


Backup power has become standard infrastructure across critical commercial sectors. Data centers pair battery-based uninterruptible power supply systems with backup generators while hospitals, financial institutions, and many commercial buildings maintain similar on-site capacity. This represents billions of dollars in backup assets that sit idle more than 99 percent of the time [1], depreciating steadily while generating zero revenue.
A fundamental shift is underway: leading operators are transforming these “insurance policies” into active grid resources, unlocking new value streams while strengthening grid resilience.
Target earns $200k-300k annually per store from battery systems in California [2]. Hilton’s Las Vegas property generates an estimated $0.8M yearly from a 10 MWh installation [3]. Microsoft’s Dublin data center captures €300k annually from existing batteries through frequency regulation [4]. The difference? These companies stopped seeing batteries as backup and started seeing them as grid assets.
The Revenue Stack
Modern battery systems tap multiple income streams simultaneously.
- Demand charge reduction forms the foundation—cutting peak power draws saves $150-400k annually for typical commercial buildings in high-cost markets [5].
- Frequency regulation adds $100-150k per MW-year in unsaturated markets [6].
- Energy arbitrage contributes $50-100k when daily price spreads exceed $100/MWh [7].
- Capacity payments provide $60-180 per kW-year where available [8].
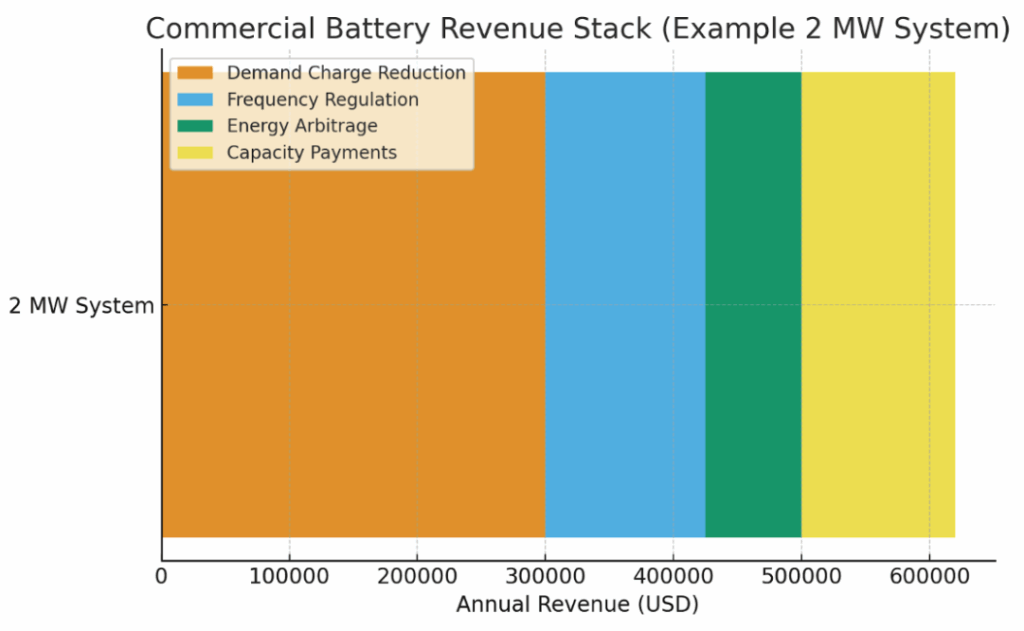
But location determines everything. California installations might achieve a 15-20 percent internal rate of return [9], while Midwest deployments rarely break even [10]. The same 2 MW system generates $750k annually in San Francisco [11], but only $150k in Kansas City [12].
Technology Evolution for Value Creation: Beyond Lithium
While lithium-ion dominates today’s market at 95 percent of installations [13][14], its limitations are becoming clear. Thermal runaway risks increase insurance costs. Capacity degrades 2-3 percent annually [15]. Round-trip efficiency of 85-90 percent limits arbitrage profits [16]. Most critically, two- to four-hour duration restricts participation in emerging long-duration markets.
Alternative technologies are reaching commercial viability. Vanadium redox flow batteries (VRFBs) offer compelling advantages for specific applications. Companies like WattSto Energy, my startup that is incubating at Greentown Labs, are deploying VRFBs that eliminate fire risk entirely—the vanadium electrolyte is non-flammable, addressing the safety concerns that plague lithium installations in urban areas. With 25+ year lifespans and no capacity degradation over unlimited cycles, VRFBs maintain consistent performance decades after lithium batteries need replacement.

The economics increasingly favor flow batteries for long-duration applications. While lithium-ion costs less upfront per kWh, total lifecycle costs converge when factoring in replacement, degradation, and safety infrastructure. More importantly, VRFBs’ 10-hour duration unlocks new revenue strategies. A VRFB system can shift entire renewable generation periods, not just peak shave. It can provide overnight firming for solar facilities. It can participate in multi-day resilience contracts that lithium cannot fulfill.
Environmental considerations also matter increasingly to corporate buyers. VRFBs use abundant vanadium that’s fully recyclable—the electrolyte retains value after decades of use. This contrasts with lithium-ion’s complex recycling challenges and reliance on conflict minerals.
Market Reality Check
Early movers captured extraordinary returns, but markets mature quickly. Texas frequency regulation prices collapsed 88 percent in one year as batteries flooded in [17]. California arbitrage opportunities compressed 70 percent between 2020 and 2024 [18]. Projects planned with four-year paybacks now face 10-year horizons [19].
Geographic concentration will intensify. By 2030, California, New York, and Massachusetts will host 60 percent of deployments [20]. These markets combine essential ingredients: demand charges above $20/kW, wholesale market access, and supportive policies. Most other states lack this combination.
Execution Complexity
The path from concept to revenue spans 18-24 months, minimum.
- Feasibility studies eliminate 40 percent of projects when interconnection costs, fire codes, or utility tariffs prove prohibitive [21].
- Permitting takes three to nine months, depending on jurisdiction.
- Construction faces six- to nine-month battery lead times.
- Commissioning rarely achieves projected returns immediately—year one typically delivers 65-75 percent of modeled revenue [22].
Software determines success more than hardware. Two identical systems in the same market can have 50 percent revenue differential based solely on optimization platform quality [23]. But advanced software costs $30-50k per MW annually and requires expertise many organizations lack [24].
Decision Framework
Deploy immediately if demand charges exceed $20/kW, wholesale markets are accessible, and your organization can manage complexity. Consider carefully between $12-20/kW—returns exist but margins are thin. Below $12/kW, wait unless non-economic factors justify investment.
Technology choice depends on the use case. Lithium-ion suits two- to four-hour applications with space constraints. Flow batteries excel for six-plus-hour duration, safety-critical installations, and 20-plus-year investment horizons. Hybrid systems combining both technologies may optimize across multiple value streams.
The 2030 Landscape
Commercial storage will grow from 15 GW today to 175 GW by 2030, but returns will normalize to 8-12 percent—similar to mature solar markets [25]. Technology diversity will increase as different chemistries serve different niches. Long-duration storage for 10-plus-hour applications will become standard for renewable integration. Safety regulations will tighten following incidents, favoring inherently safe technologies.
The transformation from backup to revenue generator is real but complex. Success requires matching technology to application, understanding local market dynamics, and executing with precision. The infrastructure build-out phase has begun.
Winners will be those who approach batteries as long-term grid assets, not get-rich-quick schemes—but there’s real revenue available for those who can navigate the complexities.
Alex Y. LIU is the founder and CEO of WattSto Energy, a Greentown Labs member company.
Copyright© 2025 Terawatt Times. Published with permission from the author. Excerpts may be shared with attribution.
-
References
[1] RMI (2025). “Fast, Flexible Solutions for Data Centers.” Rocky Mountain Institute.
[2] CAISO 2022 Special Report on Battery Storage
[3] Modeled estimate based on NV Energy’s Energy Storage Demonstration Program Summary (2022) and NREL’s Commercial Storage Value Stack Analysis (2023); no public disclosure from Hilton exists.
[4] Microsoft Source (July 24, 2023): “Microsoft datacenter batteries to support growth of renewables on the power grid”
[5] NREL (2023) – Behind-the-Meter Storage Economics: Commercial and Industrial Applications;California Energy Commission (CEC, 2023) – Demand Charge Analysis Report (Data in Fig. 1 Demand Charge Reduction $300,000)
[6] PJM Market Monitor (2023) – RegD Market Summary;Wood Mackenzie (2024 Q1) – US Energy Storage Monitor (Data in Fig.1 Frequency Regulation $100,000 × 2 MW = $200,000)
[7] CAISO Market Performance Report Q4 2023;NREL (2024) – Storage Value Stack (Data in Fig.1 Energy Arbitrage $100,000 × 2 MW = $200,000)
[8] PJM Base Residual Auction 2023/24;NYISO Installed Capacity Market 2024 (Data in Fig.1 Capacity Payments $25 × 2000 kW = $50,000)
[9] Wood Mackenzie (2024) – Commercial Storage Market Update;Lazard (2023) – Levelized Cost of Storage v9.0
[10] MISO Energy Storage Economic Assessment 2023;NREL Regional Comparison 2023
[11] Combined estimate based on the three components above (CEC + CAISO + Wood Mackenzie data); assumes a 2 MW system operating in a high–demand-charge market.
[12] Evergy (KS Tariff 2023) + MISO Market Data 2023
[13] Lazard Ltd., Levelized Cost of Storage v9.0 (2023)
[14] IEA, Energy Storage Tracking Report 2024
[15] NREL, Battery Performance and Degradation Study (2023)
[16] Lazard Ltd., ibid. — round-trip efficiency and LCOS assumptions
[17] ERCOT, Ancillary Services Market Report 2024 – Frequency-regulation price collapse data.
[18] CAISO, Market Performance Monitoring Report Q4 2024.
[19] Wood Mackenzie, US Energy Storage Monitor Q1 2025.
[20] BloombergNEF, US Energy Storage Market Forecast 2030 (2024).
[21] EPRI, Interconnection and Permitting Barriers for Storage (2023).
[22] NREL, Operational Performance of Commercial Storage 2023.
[23] Stem Inc., Athena Optimization White Paper 2023.
[24] Fluence, Digital Optimization Platform Pricing Overview 2024.
[25] Lazard, ibid., Levelized Cost of Storage v9.0 (2023).
[26] NFPA 855 Standard for Energy Storage Systems (2022 Ed.)
[27] Sumitomo Electric Industries, VRFB Demonstration Project Performance Summary (2022)
[28] U.S. Department of Energy, Long Duration Storage Shot Roadmap (2023)
[29] Circular Energy Storage, Battery Recycling Market Report 2024 — Recycling rates and material recovery economics.
[30] Wood Mackenzie, Global Long-Duration Energy Storage Outlook Q2 2024 — Market forecasts and LCOS comparisons for next-generation technologies